
What do CCT, CIE, and SPD mean in LED lighting?
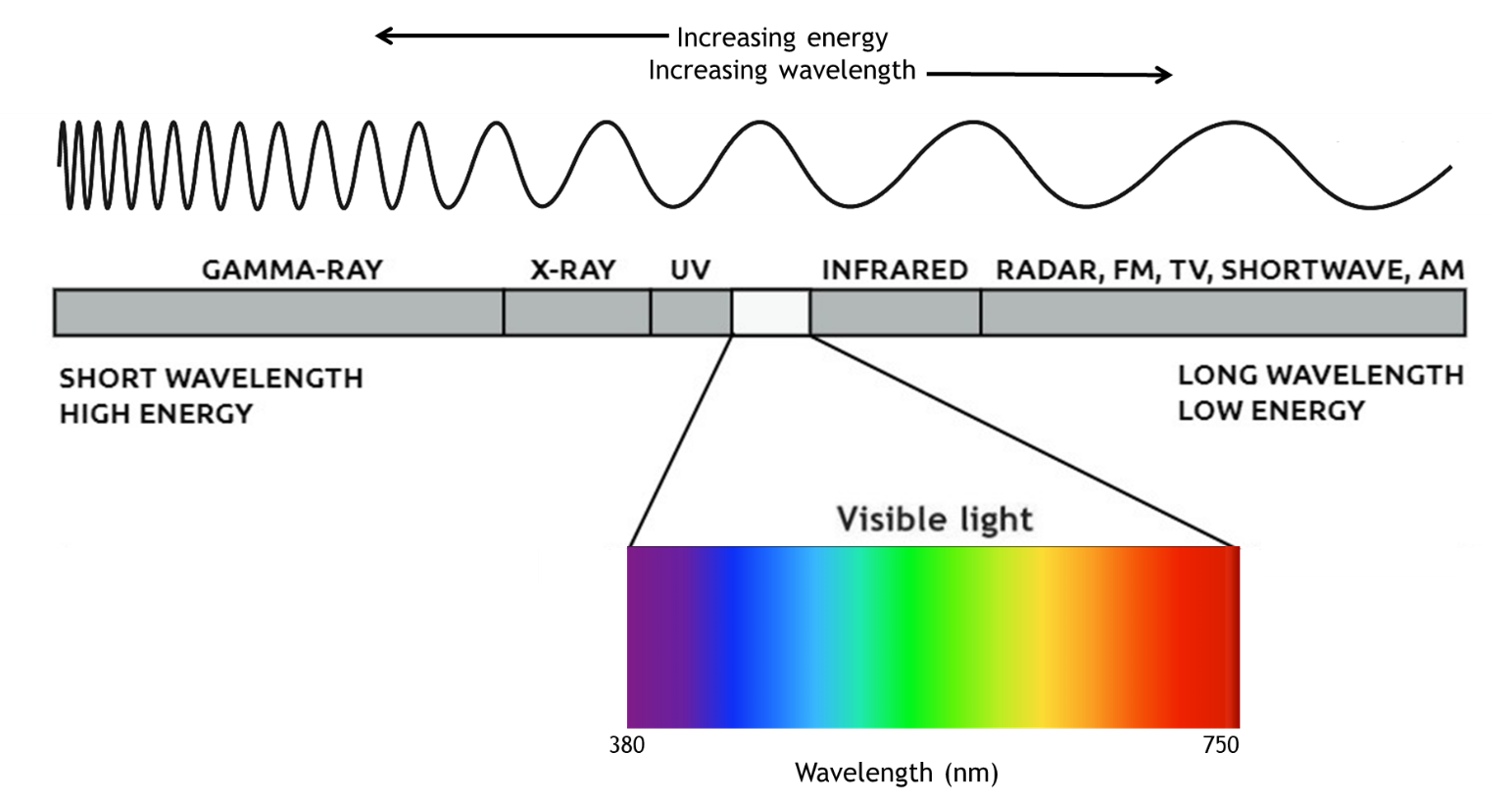
The electromagnetic spectrum extends from short wavelength, high-energy gamma rays at one end to long wavelength, low-energy microwaves and radio waves at the other. A small band in the middle of the spectrum is the range of light visible to the human eye. Visible light has wavelengths within the range of approximately 380 nanometers (nm) to 740 nm, bounded by ultraviolet (UV) at the low end of the range and infrared (IR) at the high end.
The image below shows the full spectrum of electromagnetic radiation, including invisible wavelengths such as X-rays and radio waves, plotted in order of increasing wavelength (in meters). The bottom bar is an expanded view of the visible light spectrum.
The CIE Color Space
In 1931, the CIE(Commission Internationale de L’Eclairage, International Commission on Illumination) defined a standard for scientifically quantifying the physical properties of colors. The CIE color space describes the human eye’s response to visible light and our perception of color for distributions of wavelengths. Since its inception, the CIE color space has enabled accurate measurement, representation, and replication of these colors for a vast range of applications such as printing, light sources, and illuminated display screens.
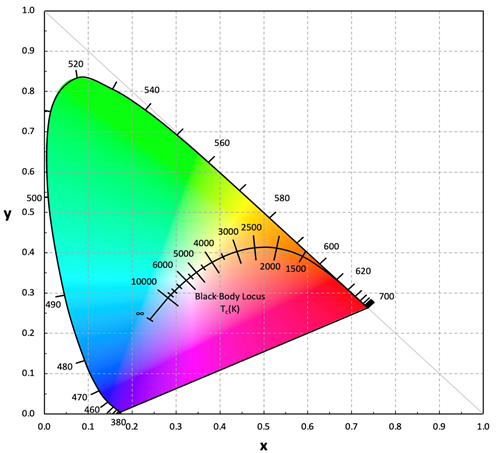
Below is a graphical representation of the CIE 1931 color space, charting all colors visible to the human eye. Numbers around the edge of the “horseshoe” are wavelengths of monochromatic light defining the boundaries of the color space. Inside the horseshoe, each perceptible color has a coordinate called CIEx, CIEy. Revisions to the original CIE color space were made in 1960 and 1976, but the 1931 version remains the most widely used version.
The Black Body Locus
The black-body locus is a plot of the chromaticity coordinates of light sources known as black-body radiators. Also called the Planckian locus, it is shown in the image above as the arc in the interior of the horseshoe. The black-body curve is shown within the CIE diagram to indicate the coordinate points where the light appears white. Artificial white light sources have color coordinates near the black-body curve. The black body (Planckian) locus coordinates Tc(K)—the points on the black-body temperature curve, is commonly called CCT.
What is a black body? It is an idealized object that absorbs all the light that falls on it (all incident electromagnetic radiation) from every angle—it has no reflectance. It is also defined as a perfect emitter, giving off radiation (typically characterized by its spectral power distribution, SPD, discussed below). You can conceptualize a black-body radiator as a platinum sphere held at a specific temperature Kelvin. The black body locus is the path traced by the black body coordinates on the CIE graph as the temperature (K) of the sphere is raised.
Correlated Color Temperature
Correlated color temperature (CCT) is a way to characterize the color appearance of any white light source with a single number. Artificial white light can be produced using combinations of all the colors in the visible spectrum. Different amounts of each wavelength will cause the light to appear “cooler” (more blue/cyan wavelengths) or “warmer” (more yellow/orange wavelengths).
The CCT of a light source is the point on the Planckian locus that matches most closely (perceptually) to the chromaticity coordinates of the light—called its color temperature. If a light source is not a black-body radiator, but its chromaticity coordinates lie close to the Planckian locus, we can characterize its color by its CCT. CCT is measured in degrees Kelvin (K): warm light is about 2700 K, neutral white about 4000 K, and cool white is 5000 K or more (Figure 7). Luminus LEDs are available across this full range of CCTs from 1800 K to 8000 K for use in a wide variety of lighting applications.
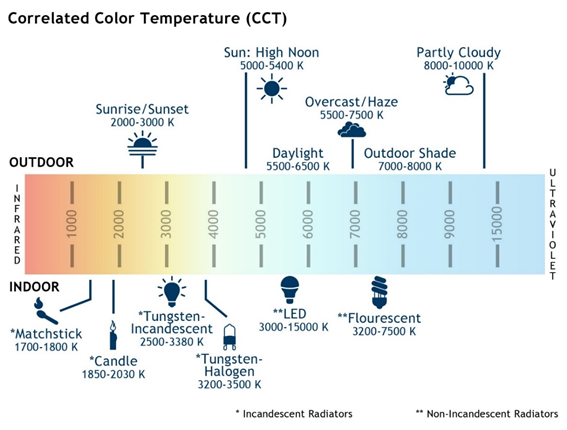
The diagram below compares the CCT of various light sources, including sunlight at different times of day and in different weather conditions, and various artificial light sources. Sunlight above the atmosphere is approximately 5900 K. Molecules in the atmosphere such as ozone absorb much of the UV and IR wavelengths, preventing us from receiving the full force of these damaging rays. As the Sun crosses the sky, it may appear red, orange, yellow, or white, depending on its position. The changing color of the Sun throughout the day is mainly the result of light scattering by atmospheric gas molecules.
Spectral Power Distribution (SPD)
One way to define light coming from any light source (a lightbulb, the sun, etc.) is by its spectral power distribution (SPD). SPD is a measurement of the energy (in Watts) that is output by the source as a function of wavelength. In other words, SPD describes how much optical power the light source emits within each wavelength band (as measured by a spectrometer).
Just as visible light wavelengths are described with terms like luminance, illuminance, and luminous flux, the entire electromagnetic output of a source is described in terms of radiance – energy output. The terms radiance, irradiance, and radiant flux have parallel meanings:
|
Quantity Measured |
Visible Light |
Total Radiant Power |
|
Total light (energy) output |
Luminous flux. Measured in lumens (lm) |
Radiant flux. Measured in Watts (W) |
|
Light from a direction |
Luminous intensity, measured in candela (cd). 1 cd = 1 lumen/steradian |
Radiant intensity. Watts per steradian (W/sr) |
|
Light incident on a surface |
Illuminance = lux. 1 lux = 1 lumen/meter |
Irradiance. Measured as Watts per square meter (W/m2) |
|
Brightness |
Luminance. Measured in candela per square meter (cd/m2) or nits. 1 nit = 1 cd/m2 |
Radiance. Measured as Watts per square meter per steradian (W/sr·m2) |
The total power is referred to as the radiant flux of the source. The radiant flux characteristics of light sources are typically represented with an SPD graph: wavelengths (in nanometers, nm) are on the X-axis, and spectral power (radiant flux) is distributed on the Y-axis. It is measured in Watts per nanometer, W/nm but is commonly normalized as an arbitrary unit such as intensity, normalized intensity, relative sensitivity, or similar.
Refer back to the black body locus shown on the CIE graph above – we said that artificial white light sources have color coordinates that reside on or very near the black-body curve. But it’s important to understand that the spectral power distributions (SPDs) of “white” light sources can include many combinations of wavelengths. Their SPDs do not always resemble the smooth curves associated with a black-body source, as seen in the image below of three black body radiators:
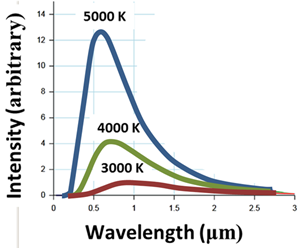
[image source: Wikimedia Commons]
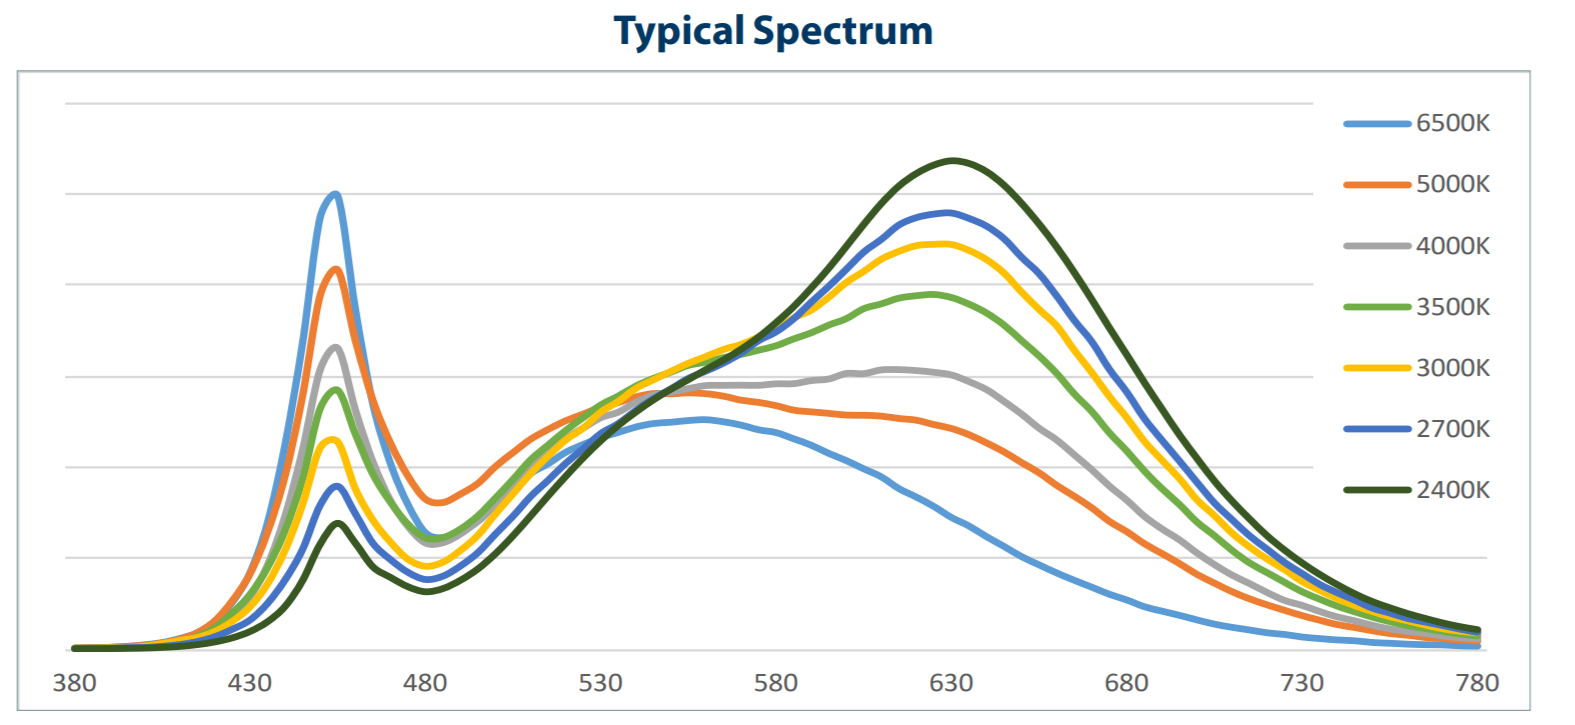
By contrast, the graph below shows the SPDs of a Luminus white LED product series, which exhibits variations across the spectrum. It has two peak values at approximately 450 nm (in the blue region of the visible spectrum) and in the approximately 525-625 nm range (in the green-yellow area of the visible spectrum).
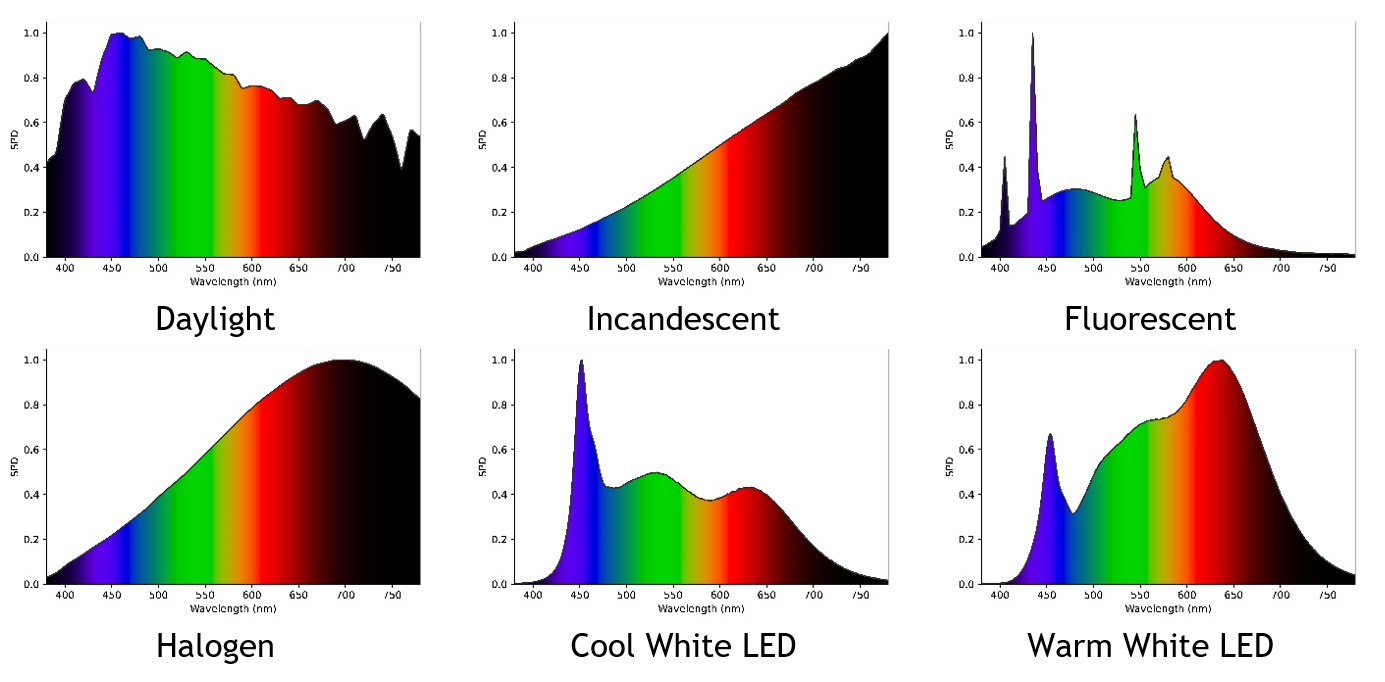
Below is a comparison of SPDs for a variety of different white-light sources. The measured SPD is combined with a mathematical representation of the human eye’s response to calculate perceived colors. The graphs demonstrate that daylight (represented here by the SPD of typical winter morning light in the Northern Hemisphere, upper left) offers a broad spectrum. Red wavelengths dominate incandescent bulbs, for example. You can design LEDs to offer a wide range of different white color temperatures.
Note that SPD is not equivalent to CCT. CCT characterizes how humans perceive the color tonality of a light source; SPD captures the entire spectrum of wavelengths that is output by a light source, including some that are invisible to the human eye. You can understand CCT as an approximation of spectral content. Lighting designers typically refer to CCT values when creating a lighting scheme.


